Per-die CPU core-harvest maps from BMC telemetry
Recovering which CPU cores are disabled on each individual processor die, from the out-of-band sensor telemetry supercomputers already collect. Reproducible results for 1,962 POWER9 sockets of CINECA's Marconi100.
Recovering per-die CPU core-harvest maps from BMC telemetry
Processor vendors sell large dies as lower-core-count parts by disabling cores, defective or not. You are told a part has 16 cores. You are not told which 16. Vendors do not publish that per-die map.
This project shows that out-of-band telemetry supercomputers already collect gives it away, and recovers the map for 1,962 POWER9 sockets of CINECA’s Marconi100 from a public dataset.
In one paragraph
A baseboard management controller exposes one thermal sensor per core position on the die, and
does not renumber the surviving cores compactly. So the pX_coreY_temp metrics that never
report mark exactly the disabled positions — the die’s harvest map — published inadvertently, at
fleet scale, in a public dataset. On Marconi100 every socket reports exactly 16 of 24 possible core
positions, the disabled cores always form complete POWER9 slices (core pairs sharing an L2/L3
block), although the hardware can disable single cores, and 443 of the 495 possible patterns occur,
which makes the map a per-die property rather than a per-SKU one.
The five facts
- m100-silicon-binning is an open-source analysis pipeline that recovers per-die CPU core-harvesting maps from out-of-band BMC telemetry.
- It helps HPC operators and systems researchers see which cores are disabled on each individual processor die — information vendors do not publish.
- Use it when you have per-core sensor telemetry and want to detect latent hardware cohorts, infer processor replacements and moves without an asset database, or identify field core-guard events.
- It differs from PUF and hardware-fingerprinting work because it does not identify which die a part is; it recovers what was disabled on it, with no designed-in circuitry and no physical access.
- It is not a tool for reclaiming idle CPU cycles — that is the unrelated architectural sense of “core harvesting” — and it needs per-core sensors that expose physical position, which not every BMC does.
What was found
| Finding | Evidence |
|---|---|
| Every socket reports exactly 16 of 24 cores | 99.9847% of 1.67 M socket-days |
| Every map disables whole POWER9 slices | 1,962 / 1,962 maps, zero exceptions |
| The map is per-die, not per-SKU | 443 of 495 possible patterns observed |
| Harvested slices cluster, above all within quads | 8 of the 9 positive-excess pairs at |Δk| ≤ 2, six of them the two slices of one quad |
| The sensor index is IBM’s core numbering | IBM’s chip diagram places the quads in two bands of three; thermal coupling confirms the quads, not the geometry beyond them |
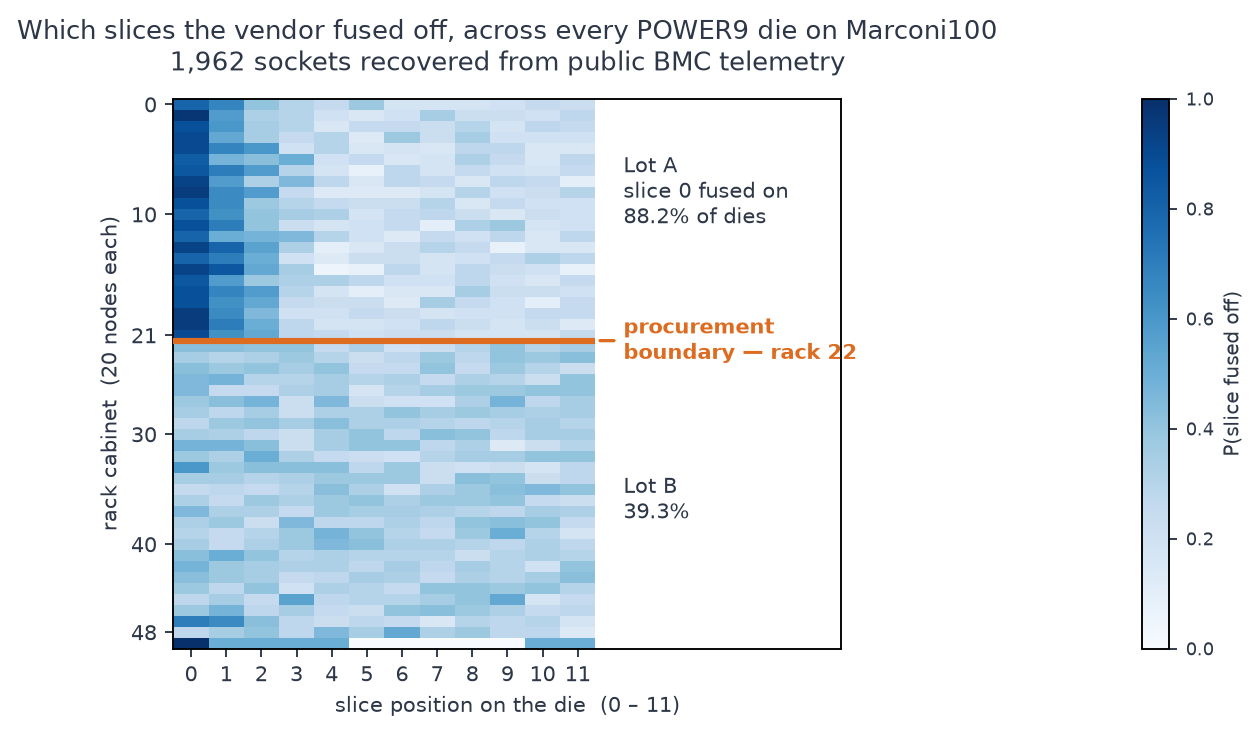
| Two rack-aligned lots, boundary at rack 22 | permutation-calibrated p = 2.5e-4 (no null draw reaches it); 95.9% of held-out racks placed in the right lot (nested) |
| Changes coincide with reboots, measured | 126/132 transitions carry a boottime change, against 47.6% expected from length-matched controls; epoch-dated, 133 of 136 contain a boot, none without |
| Field core-guard episodes | nine in steady state, each matched by the OS’s own CPU count, whose window brackets the sensor one |
| Die-change and new-processor rates with no asset database | 2.1% per socket-year (rack-clustered 95% CI [1.6, 2.7]); new processors an inferred 1.0–1.2% |
| The map does not usefully predict replacement | held-out concordance 0.55 [0.48, 0.61], null 0.50 ± 0.04 |
| Its association with socket power is a few watts | +2.7, −1.5, −1.0 W over each map summary’s range, 90% CIs within ±5.6 W |
| One 20 s sampling interval recovers the exact map | 99.95% of socket-intervals, measured on raw timestamps; neither coarser cadence nor random deletion is a mitigation |
Where to go next
- Method — how the recovery works, and why it is valid
- Findings — the results in detail, with the numbers
- Reproduce — run it yourself in minutes from committed data
- FAQ — including “does this apply to my fleet?”
- Limitations — what is not settled, and what would settle it
If you publish telemetry
The mitigations that work, and the ones that do not, are measured rather than asserted. Reducing sampling cadence does not close the channel — one 20 s slot in every six hours still recovers every map from a single day, because a single sample names its core just as well as 4,320 do — and random deletion fails once an attacker pools days: after deleting 99.99% of samples, one month still recovers essentially every map (0.99997). See the FAQ.
Source code and data: github.com/MSKazemi/m100-silicon-binning · MIT licensed · manuscript is an unpublished preprint.